
A tour of the DevOpsPad workspace
DevOpsPad has two workspaces in one window. 中间件 (middleware) is the read-only workbench for databases, caches, streams and cluster resources. Infra is the application console for K3s and Kubernetes environments: nodes, artifacts, releases, Deployments, Pods, logs and configuration. You switch between them at the top of the navigation rail on the far left.
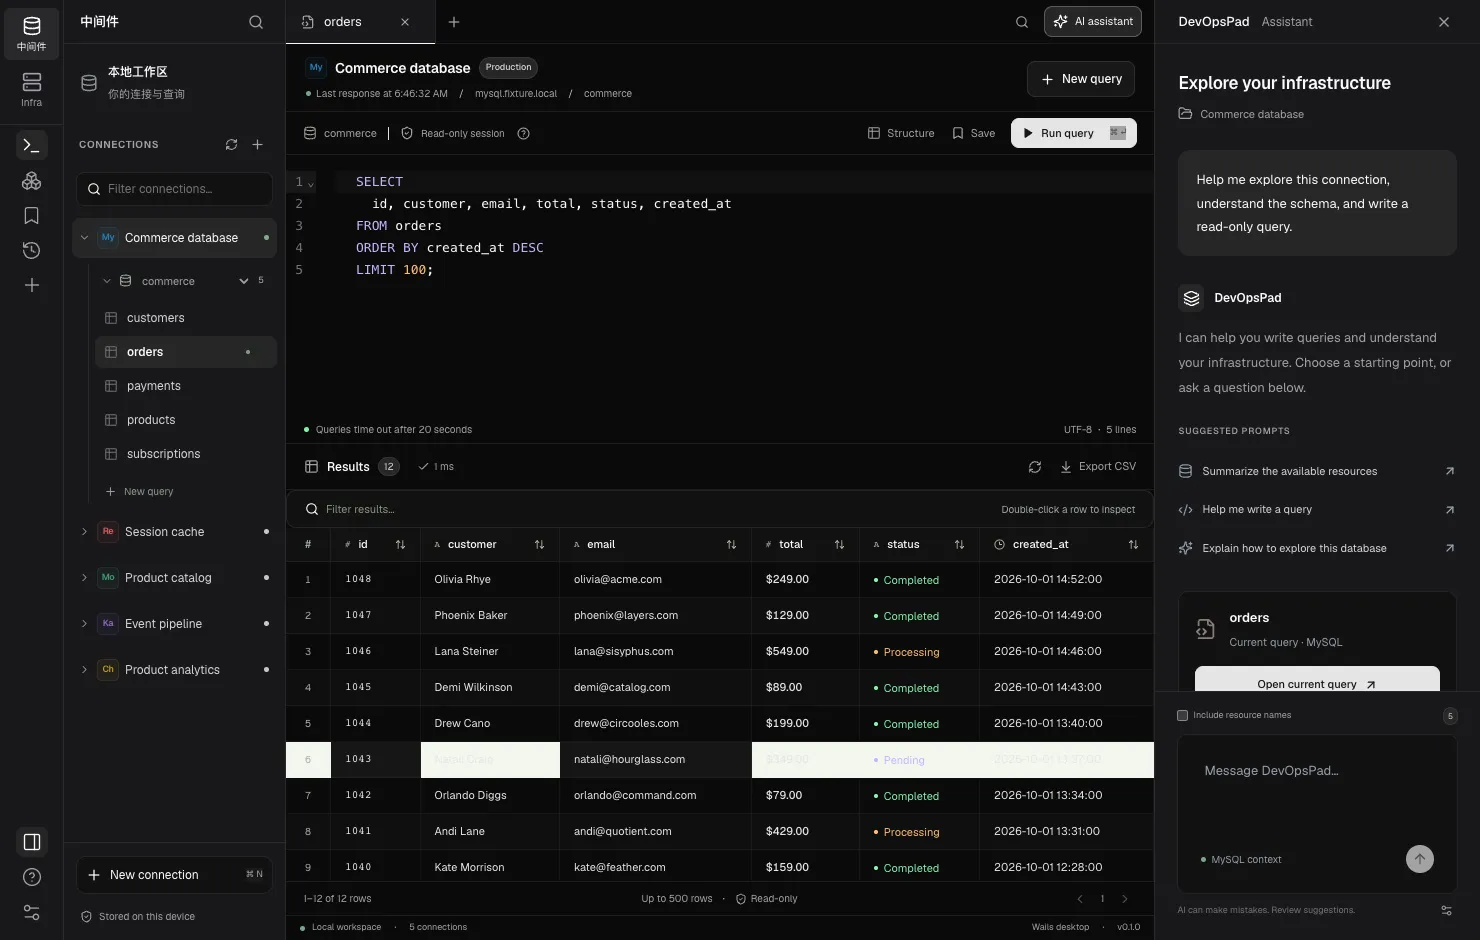
Inside the workbench, the screen reads left to right: the rail, the Explorer with your connections, the query area with tabs, editor and results, and an optional AI assistant panel on the right.
Navigation rail
From top to bottom:
- 中间件 and Infra: the two workspaces.
- Workbench: query tabs, editor and results.
- Connections: every saved connection as a card, with its environment, engine, host and buttons to open, edit or delete it.
- Saved queries and Query history. See saved queries and history.
- + (New connection).
- At the bottom: Toggle AI panel, Help and keyboard shortcuts, and Settings.
Explorer
In the 中间件 workbench the Explorer lists your database, cache and Kafka connections under CONNECTIONS, with Refresh resources and New connection buttons and a Filter connections… box. Expanding a connection shows what DevOpsPad found on it: databases and tables for MySQL and ClickHouse, keys for Redis, collections for MongoDB, topics for Kafka, Click an item to open it in a query tab. Kubernetes and K3s connections are listed in Infra under 集群资源 (cluster resources), which uses the same Explorer, tabs and results.
The footer says Stored on this device: connection metadata stays on your Mac and secrets stay in the keychain.
Query area
- Tabs along the top. Each tab keeps its own connection, database or namespace scope, and tabs survive switching between 中间件 and Infra. See query tabs.
- Header with the connection name, its environment label, and the time of the last successful response (or Last request failed / Not yet verified). An SSH tunnel marker appears when the connection uses one.
- Toolbar with the current scope, the Read-only session marker, Structure or Key details for an inspectable table or key, Save, and Run query.
- Editor with SQL, JSON or plain-text syntax depending on the engine. Queries time out after 20 seconds.
- Results with sorting, a Filter results… box, pagination, row inspection (double-click a row) and Export CSV. See filter and sort results.
Status bar
The bottom bar shows Local workspace, the number of connections, whether you are in the desktop app or the browser preview, and the app version.
AI assistant panel
Open it with AI assistant at the top right or the rail toggle. It shows the selected connection, suggested prompts and a message box. Include resource names is off by default. Suggestions are inserted into the editor and never run automatically. See configure an AI provider.
Infra
The Infra workspace has its own sidebar grouped into cluster, deployment, observability and configuration pages, and an environment selector. Kubernetes and K3s connection management stays available there under 集群资源 (cluster resources). Start with the Infra overview.